|

|
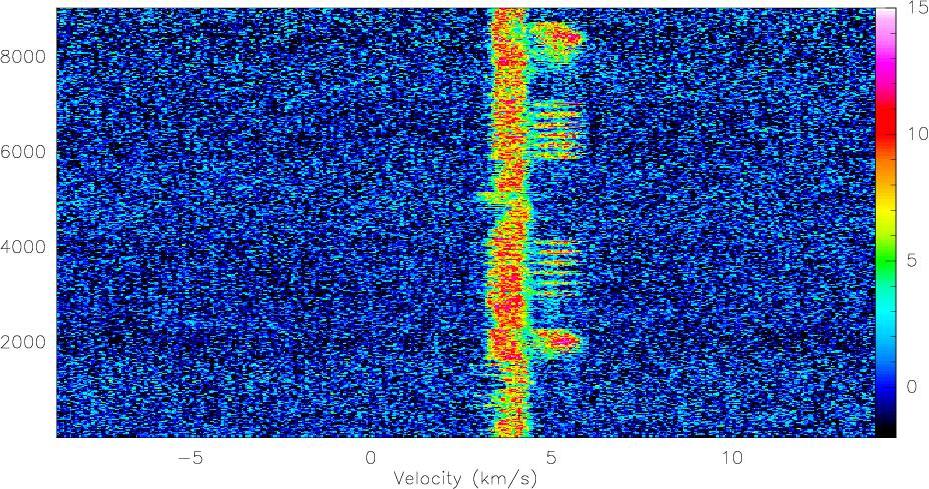
The following list of commands is all you need to plot as a single image
(see Fig. ![[*]](crossref.png) ) 9000 dumped spectra part of 200 OTF
scans observed in
) 9000 dumped spectra part of 200 OTF
scans observed in ![]() 4 hours.
4 hours.
          LAS90> lut rainbow3
          LAS90> file in 12co21-newfmt.30m
          LAS90> find
          LAS90> load
          LAS90> set mode y -2 15
          LAS90> plot /index