

Next: PLAIT algorithm
Up: Miscellaneous changes
Previous: Command names
Contents
Griding and spectra cube visualization
The functionalities of the old ANALYSE\GRID command has been
redistributed and extended in several commands:
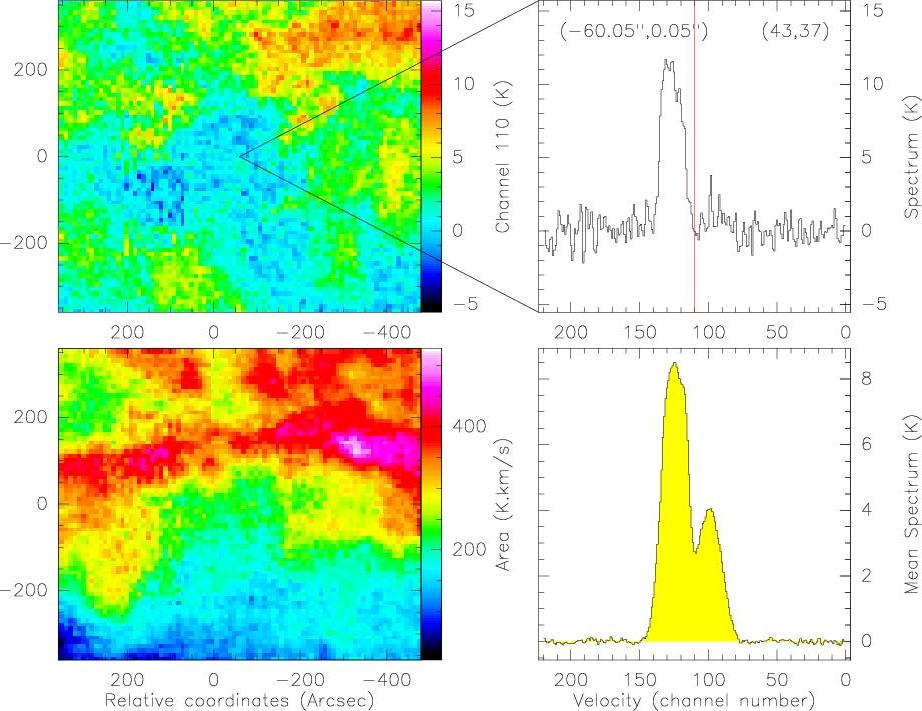
Figure:
Screen-shot of result of the go view command. The
top,left panel is the channel map corresponding to velocity shown as a
vertical red line in the top,right panel. The top,right panel displays
the spectrum at the position localized on the top,right panel. The
bottom,left panel shows the line emission integrated over the velocity
range appearing in yellow on the bottom,right panel. This last panel
displays the spectrum averaged over the whole map. go view is
an interactive command with many more features. Please, type h
to display the complete help.
|
|


Next: PLAIT algorithm
Up: Miscellaneous changes
Previous: Command names
Contents
Gildas manager
2014-07-01
![[*]](crossref.png) has been
obtained with the following sequence of commands:
has been
obtained with the following sequence of commands:
