

Next: Gridding Spectra on a
Up: Spectra Line Processing
Previous: Adding Spectra
Contents
Index
The CLASS user may analyse spectra by fitting profiles. The fitting
commands are available from the FIT language. The minimization method is
taken from the MINUIT system of CERN, modified and optimized for this
purpose. Reliability proved to be good. Five types of profiles are
presently available, and can be selected by the METHOD command:
- METHOD GAUSS This is the default type of profile. One may use
up to five Gaussians, which might depend on each other as specified by a
system of control codes associated with each variable. For each of these
Gaussians, the primary parameters are: 1) Area, 2) Position, and 3) Width
(FWHM). The current X unit (for the lower axis) is used. Code 0 means
that the parameter is adjustable; 1 that it is fixed; 2 that the
parameter (head of group) is adjustable and that another parameter, coded
3, is fixed with respect to it; 4 that the parameter is a fixed head of
group.
- METHOD SHELL (see details below) Profiles are like those
encountered in envelopes of stars. The primary parameters are Area,
Position, Width and Horn to Center ratio. The aspect of the profile
varies from parabola (as obtain in optically thick lines) for
Horn/Center = -1 to flat-topped lines (unresolved optically thin
lines) for Horn/Center = 0 and double peaked profiles (resolved
optically thin lines) for Horn/Center > 0. The profile is
symmetric. Presently only code 0 and 1 can be used, and up to 5
independent lines can be fitted in a single spectrum. The X unit
must be frequency.
- METHOD NH3(1,1) or NH3(2,2) or NH3(3,3)
Profiles taking into account hyperfine structure of ammonia with a
Gaussian distribution of velocity are fitted. Primary variables are 1)
The product (Main Group Opacity) times (Excitation Temperature minus
Background Temperature) 2) Velocity 3) Line Width (FWHM) and 4) Main
Group Opacity . Up to 3 independent lines can be fitted, and only codes
0 and 1 are allowed. The X unit must be Velocity.
- METHOD HFS FileName This method is similar to the
previous one, but the HyperFine Structure parameters are read from a file
instead of being known by CLASS . The first line of this file must
contain the number of hyperfine components (
 ). The other lines must
contain, for each component, the velocity offset and the relative
intensity. The parameters are the same as for NH3 method.
- METHOD CONTINUUM This method is used for continuum drifts. It
fits a Gaussian and a linear baseline in the drift. If beam-switching was
used and the reference beam is along the drift direction, two dependent
Gaussian are used to optimize signal to noise. The method does not
require any user input.
METHOD SHELL in details. The fitted function is:
where the fitted parameters are:
-
 : the area under the profile (in K MHz),
 : the middle frequency (in MHz),
-
 : the full width at zero level (in MHz),
 : the Horn/Center parameter (dimensionless, see below)
The central value is
 whilst the value at the edge is
 . The edge-to-center intensity
ratio value is thus dictated by the Horn/Center parameter
  according to
The center-to-edge frequency shift corresponds to an expanding
velocity
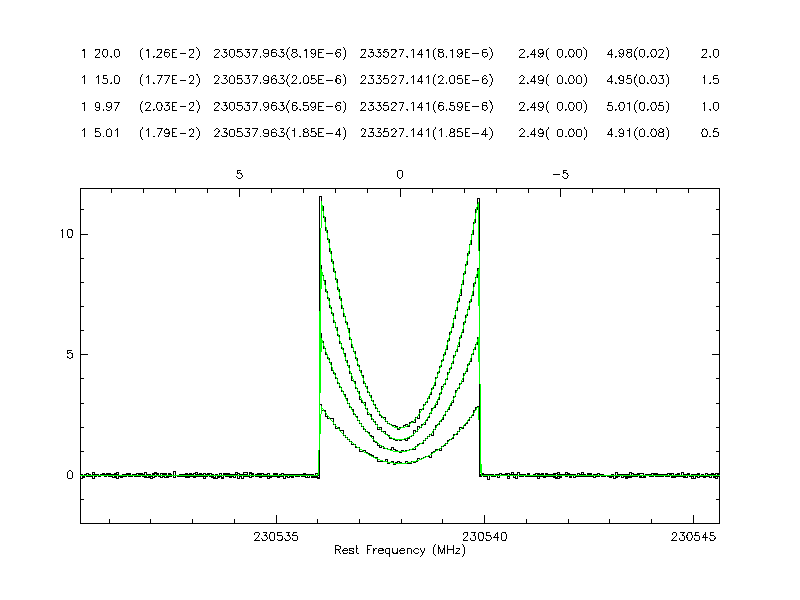
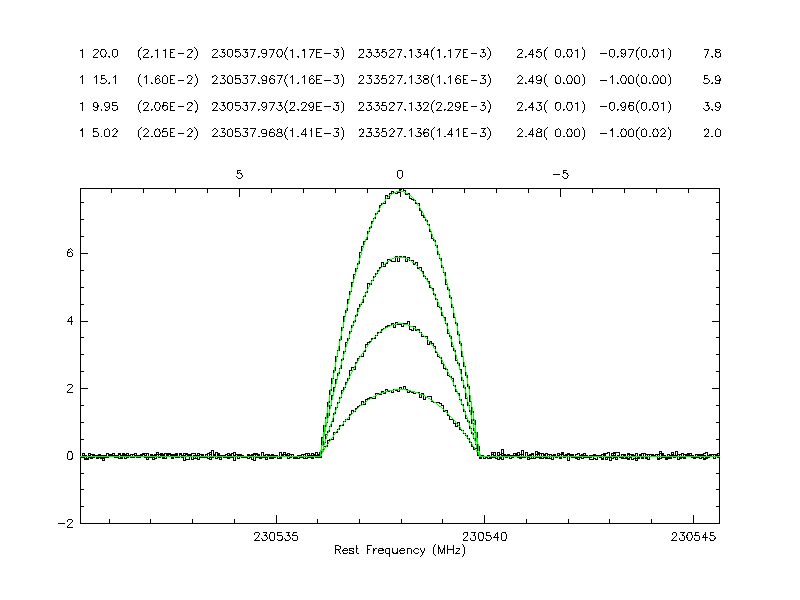
Figure ![[*]](crossref.png) shows synthetic shell-like profiles, for which
the area takes values
shows synthetic shell-like profiles, for which
the area takes values
 to 20 by 5 K MHz. The full width at
zero level is
 MHz in all cases, which corresponds to
 km.s
km.s
 at 230.537 GHz. The Horn/Center parameter is
 (top) or
  (bottom, for which the intensity at the edge is
zero).
The FIT commands are:
- LINES N defines the number of components and prompts for
the initial values of the parameters for each component. This command has
no effect for method CONTINUUM. Parameters are read in list
directed format in the following order:
Code, Intensity, Code, Position, Code, Width, [Code, Parameter 4]
The code is an integer number between 0 and 4. Note that, though the
program works on the area (or other quantities as for NH3 methods),
you have to give the intensity, since this quantity is more intuitive
than area. The use of the list directed format makes things easier when
only one parameter has to be modified (cf Fortran norms). The number of
lines N may be zero; in this case the program finds out reasonable
starting values by itself.
Values may be also entered graphically if the cursor is
available. After entering LINES N, first point the cursor to
one side of the line, strike one key, point the cursor the other
side, strike another key. The program computes the moment of the
spectrum between these boundaries and use it to set up starting
values. Proceed like this for all components. One drawback of this
way of entering values is that you cannot change the control
codes. It should be used only for entirely independent and free
lines.
- MINIMIZE activates minimization, then prints out the results
after convergence. A Simplex method is first used to ensure convergence,
then a Gradient method to refine the results, and compute the errors.
- ITERATE is similar to MINIMIZE, but starts from the
previous minimization results. Only the Gradient method is used.
Consequently, this command is only useful close to the minimum.
- VISUALIZE [N] [/PEN] plots the
 th component obtained
by fitting; if
  is not given, the sum of all components is plotted.
- RESIDUAL N subtracts the Nth component from the current
spectrum, or the sum of all components is N is not given). In this
process, the R spectrum is first copied into T, then the
difference is done in R.
- DISPLAY Prints the results of fitting from the current
spectrum, without recomputing it ...
- KEEP Saves the fit results in the input file, which must be
opened also for output. KEEP is in fact a reduced version of UPDATE, and to be used with the same care as UPDATE.
- SET MASK ... Defines masks in the spectrum for the fit.
This commands has the same syntax and behaviour as SET WINDOW.
Masked regions will not be used for the fit.
Fit results are always saved by a WRITE command and made available
through the corresponding variable section (see SET VARIABLE help).


Next: Gridding Spectra on a
Up: Spectra Line Processing
Previous: Adding Spectra
Contents
Index
Gildas manager
2014-07-01
![[*]](crossref.png)

