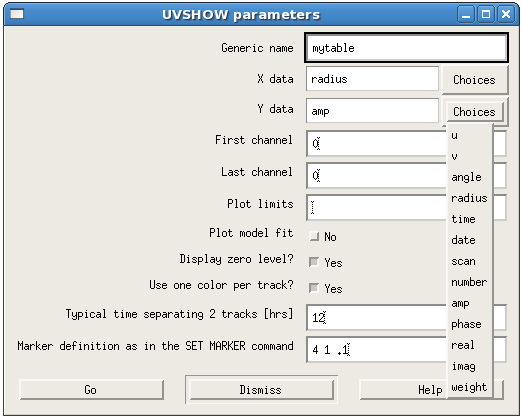
UVSHOW plots the uv-data. By default amplitudes vs. uv-radii are presented, for all visibilities and spectral
channels. The UVSHOW parameters widget (see Fig. ![[*]](crossref.png) )
permit to select the visibility's characteristic (amplitude, real
part, weight, etc.) to plot. By default the different tracks are
plotted with different colors. Plotting a model fitted by UVFIT is
possible by clicking in the corresponding option.
)
permit to select the visibility's characteristic (amplitude, real
part, weight, etc.) to plot. By default the different tracks are
plotted with different colors. Plotting a model fitted by UVFIT is
possible by clicking in the corresponding option.