To have a look at the conditions in which the observations were
obtained click on the First Look in the CLIC menu (Figure
![[*]](crossref.png) ). An extended version of the First Look is used
by the AoD and by the pipeline procedure (see
App. ).
). An extended version of the First Look is used
by the AoD and by the pipeline procedure (see
App. ).
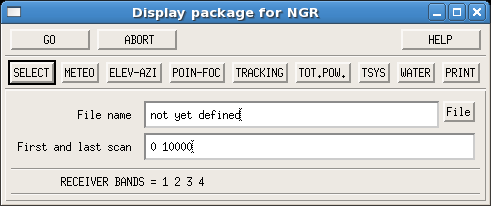
An hpb file name is needed to start with the First Look
widget (see Figure ). The scan range can also be
specified. By default all the scans are taken into account (i.e. from
0 to 10000). The receiver with which the source(s) was
observed is determined by clicking on Select.
Select is also necessary to assess the presence of data, and to define variables needed in the following calibration steps. The options from Meteo to Water can be clicked with no defined order. Each of them creates one or two plots and then pauses waiting for a ``continue'', in the CLIC prompt, in order to save the displayed plots in postscript files. Print combines all these postscript files in a file called show-'date'-'projectname'.ps, including also a description of the observational setup and a detailed scan list.
This package is actually not interactive since it does not admit an input other than ``continue''. With GO we can therefore obtain the same result as by clicking through the buttons, from Select to Print. It is recommended to check the First Look report to identify instrumental features, errors, verify weather conditions, etc. This information becomes particularly relevant to take adequate decisions in case of calibration difficulties.
Note that all the plots created with the First Look are
presented for physical antennas6, while the
calibration procedures refer to logical antennas7. Sometimes
the AoD refers in his/her notes to physical antennas, but note that
all the CLIC commands refer to the logical ones. In the section 1.2
of the calibration report (see Sect. and
), efficiencies are presented for logical
antennas, the equivalent physical numbers are shown into parenthesis.
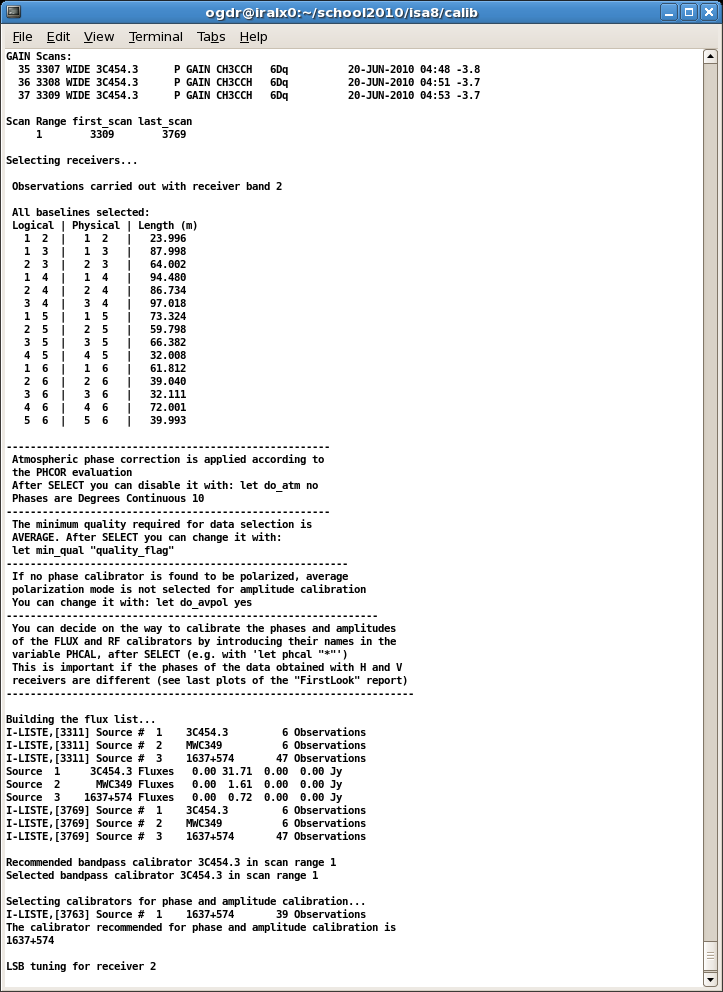
Select, in addition to selecting the used receiver(s), adopts
default settings for data presentation, reports on the amount of
correlations obtained, defines scan ranges between tunings by looking
at the gain scans, reports on the used baselines and antennas,
on the array configuration, on the used calibrators and their fluxes,
and the tuned band. Select also introduces in the widget the
option to select telescope configuration if that changed during the
observations. Information is given in the line of commands, which is
specially relevant for calibration (as shown in Figure ).
|
|
Meteo provides information on the atmospheric conditions at the time of the observations: Ambient temperature (in K), relative humidity (%), pressure (mbar) and the mean and maximum wind speed (m/s).
Elev-Azi plots the elevation and azimuth of each scan, so that we can see the relative position of a source with respect to the calibrators.
Poin-Foc presents the pointing corrections (in arc seconds) in
azimuth and elevation, and the focus corrections (in mm) per
antenna. Note that pointing and focus measurements are performed
typically every ![]() 50 min (i.e. every two transitions on source)
50 min (i.e. every two transitions on source)
Tracking shows the rms of the tracking variations (in arc seconds) in azimuth and elevation.
Tot. Pow. displays the total power (in K) obtained per correlator input8.
Tsys plots the system temperature (in K) along the track, for the tuned and the rejected band. Note that after January 2007 all receivers installed at Plateau de Bure are operated in single side-band mode. A plot is created per correlator input8.
Water shows the values derived for the water vapor pressure (in
mm) by modeling the atmospheric behavior from the data obtained with
the astronomical receivers. The water vapor pressure (WVR
H![]() O) obtained from the 22GHz receivers is also shown. Note that
the 22GHz receivers are only sensitive to water vapor, while the
astronomical ones permit to obtain a rough estimate of the water in
the atmosphere, including liquid water. A plot is created per
correlator input8.
O) obtained from the 22GHz receivers is also shown. Note that
the 22GHz receivers are only sensitive to water vapor, while the
astronomical ones permit to obtain a rough estimate of the water in
the atmosphere, including liquid water. A plot is created per
correlator input8.
Print combines all the plots in a file of name show-`date'-`projectname'.ps.
AoD or pipeline First Look: The astronomer on duty carrying out
the observations performs a deeper analysis of the data. The file
created by the AoD First Look includes more technical plots,
related to receiver calibration, bandpass stability, correlator
tweaks, 22GHz receivers, cables transporting the synthesizer
signals, etc (briefly described in App. ). The AoD
may include remarks in the project note file (see
Sect. ) if the inspection of these plots reveals
problems to be considered in the calibration.