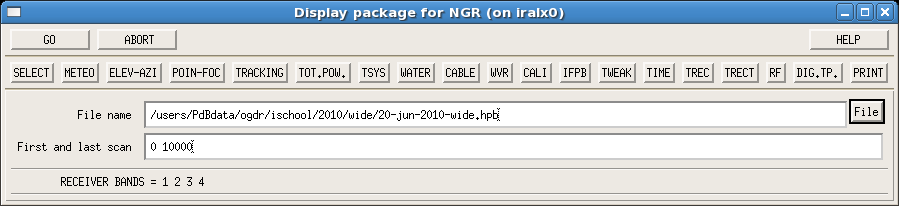
The First Look report created by the pipeline is much
longer than what is available under the CLIC First Look widget
(Sect. ![[*]](crossref.png) ). This report provides detailed and
critical information of system performance to the AoD. It shows hence
various technical aspects which may be difficult to interpret by
non-trained astronomers. Here we briefly describe the content of these
plots.
). This report provides detailed and
critical information of system performance to the AoD. It shows hence
various technical aspects which may be difficult to interpret by
non-trained astronomers. Here we briefly describe the content of these
plots.
Summary: The first page of the First Look report shows the correlator setup, for the Narrow-band and Widex correlator units8, and the number of correlations obtained on each source. Warnings are often included, and are mainly addressed to the AoDs for technical assessment.
Meteorogical data: See details in Sect. . The
verification of the wind speed is particularly important for AoDs if
tracking problems are found in the ``Elevation and Azimuth'' plot.
Elevation and Azimuth: See description in
Sect. . Colored lines are included to mark flagged
scans or records (seconds). Deep blue lines refer to flags due to
antenna shadowing, red to correlator unit flags, solid pale blue lines
to DATA (correlator related) flags, dashed pale blue lines to
tracking problems, green to phase lock losses, yellow to doppler or time
issues, and pink to outliers in the system temperature, pointing
problems or user or pipeline flagged data. More details about the
flags can be found in ``Flag data List'' paragraph presented below.
Pointing and Focus corrections: See description in
Sect. . Colored lines are included if pointing or
focus corrections change by more than 30% the size of the primary
beam or wavelength, respectively.
Antenna Tracking Errors: See description in
Sect. . Problems are often related to strong
wind. It may happen, though it remains very rare, that large tracking
errors indicate a technical problem. This monitoring is particularly
important to foresee interventions by the technical staff at PdB.
22GHz monitors present the results obtained in time from the 22GHz receiver in each antenna. The first three plots show the counts obtained in each of the three channels of the 22GHz receivers. They are combined to produce the `triple' values, which are used to model the atmosphere, disentangle between water vapor and droplets, and predict the atmospheric phase fluctuations by which the interferometric data are affected. This is then used to reduce of phase decorrelation within each scan. Derived water vapor amounts are displayed in the `Water Monitoring' plots. The given ambient temperatures are obtained by sensors placed close to the 22GHz receivers. Peltier Temperatures are directly related to the receiver performance, and should remain within the plot limits.
CALI scans vs time plots show the time evolution of the CALI autocorrelation scans, which can consist of two (on the hot
load and sky respectively) or three (on the cold load, hot load and
sky) subscans. Measurements on the cold load are typically performed
every ![]() 50 min, and are used to derive and monitor receiver
temperatures. Differences between antennas are normally linked to
receiver attenuations, and differences between units are often linked
to correlator tweaks. In correct weather conditions, the sky
autocorrelations show a constant value because the signal variations
due to airmass change is compensated by correlator tweaking. This
tweaking effect is however visible in the autocorrelations on the
loads. (Note that Widex tweak levels change in large steps.) Strong
variations in the input signal often result in changes in the tweak
values, and accordingly in the CALI autocorrelations.
50 min, and are used to derive and monitor receiver
temperatures. Differences between antennas are normally linked to
receiver attenuations, and differences between units are often linked
to correlator tweaks. In correct weather conditions, the sky
autocorrelations show a constant value because the signal variations
due to airmass change is compensated by correlator tweaking. This
tweaking effect is however visible in the autocorrelations on the
loads. (Note that Widex tweak levels change in large steps.) Strong
variations in the input signal often result in changes in the tweak
values, and accordingly in the CALI autocorrelations.
IFPB scans vs time plots present the time evolution of the
amplitudes of the IFPB correlations obtained on the noise source
(see Sect. ). Absolute amplitude values change from unit
to unit, depending on the IF phase delay. As the noise diode provides
a constant input, IFPB amplitudes should remain constant along a
track. Sharp variations in the tweak levels (for instance due to bad
weather) can however result in changing amplitudes of the IFPB scans,
due to tweaking adjustment effects.
Tweak levels vs time plots show the tweak levels for each of the Narrow correlator units, per correlator sub-band. Values remaining constant (in correct weather conditions) in time correspond to the IFPB scans, tweak values change with the airmass for the other acquisitions.
Monitoring the time, UTC, NTP and PPS. The monitoring of the time synchronization signals is important as it is essential to stop fringes, ensure a good pointing, etc. This plot helps us to monitor differences in time between the UTC (from the maser-synchronized GPS) and NTP ([GPS-]synchronized NTP) times, as well as time offsets between hardware clocks (PPS used by the correlator from maser-synchronized GPS time) and software synchronized events (NTP).
Receiver Temperatures in the IF plots present the receiver temperature computed along the IF bandwidth from one of the first CALI scans including a cold load acquisition (often called `cal-cold' scan). Different colors are used to identify the different correlator inputs. These plots shows better than any other the presence of parasites and tuning features. Particularly, marks are included to identify the known system parasites (from the IF processor at 6300, 4500 MHz, and at 3 and 4 times the LO1ref local oscillator frequencies). Dotted lines represent the values stored in the data header, computed by the online RDI software.
Receiver Temperatures vs Time plots display the evolution of the mean receiver temperature values averaged over the correlator-input8bands. They should not change by more than a few K in projects with stable tunings. Tunings affected by strong parasites may show changing receiver temperatures. An intervention from the frontend group may happen as a consequence of the information extracted from these plots.
Dewar Temperature plots show the temperatures measured at various stages in the cryostat.
Observing List summarizes the sequence of obtained scans. CALI and IFPB acquisitions are ignored in this list.
Flagged data List shows all the flagged records and scans. It should be consistent with the color marks in the 'Elevation-Azimuth' plots.
Total Power vs time: See description in
Sect. . Values are presented per each calibration
unit (which correspond to correlator inputs8): Two
Narrow Quarters and four Widex units. Moderate differences (of a few
K) in the values from the different units are due to the different
covered frequency ranges.
Cable Phase plots present the phase delays (in degrees) produced
at the Master Frequency level by the cables in their movements, mostly
due to antenna tracking, for the used and unused bands. Colored lines
mark changes that could result in phase variations larger than
30![]() . Significant changes in the LO1ref local oscillator
frequencies are also displayed in grey lines.
. Significant changes in the LO1ref local oscillator
frequencies are also displayed in grey lines.
System Temperatures vs time: See description in
Sect. . Plots are shown per calibration unit.
Water Vapor vs time: See first description in
Sect. . A plot is created per calibration unit. A
differential plot is created to compare the results obtained from all
the antennas. Pale blue lines in the WVR H![]() O plots mark the update
of the 22GHz receiver calibration by the online software.
O plots mark the update
of the 22GHz receiver calibration by the online software.
RF phases plots compare the phases obtained per correlator input
in the (IF1) frequency band. Remaining phase delays can be identified
in these plots. One plot is created for the first correlation scan at
the project start, another for the last correlation scan at the
project end. Note that if the (frequency averaged) phases from H and V
polarization receivers are not equal, ``let phcal `*' '' should be
entered after Select (see Sects. and ).
Amplitudes for Narrow and Widex correlator inputs: Comparison of
the signal level obtained from all the correlator
inputs8(or calibration units), which -in principle-
should be almost identical. Uncorrected delays result in amplitude
differences among the correlator units, which become particularly
important between the Widex and the Narrow-band correlator
units. Delays can be identified in the RF phases and the RF
calibration plots, and the data can be corrected for them by
following the instructions in Sect. .